 The Trading Shark
The Trading Shark
The Trading Shark

Trading Engineering
Fish follow the current. Sharks hunt for the edge.
What we do
We don't just analyze the markets; we engineer our edge. While anyone can execute a trade, building a robust, scalable operation requires a fundamentally different foundation. We apply the principles of systems architecture and scientific research to quantitative trading.
Our infrastructure is built on deep technological integration. By combining data science, AI, and Big Data with continuous automation and monitoring on Google Cloud, we transform market noise into precise quantitative models. For us, trading is not speculation — it is a rigorous, technology-driven discipline.

How we do it
We don't build yet another indicator; we engineer our own custom software and quantitative frameworks to design strategies based on price action and market behavior.
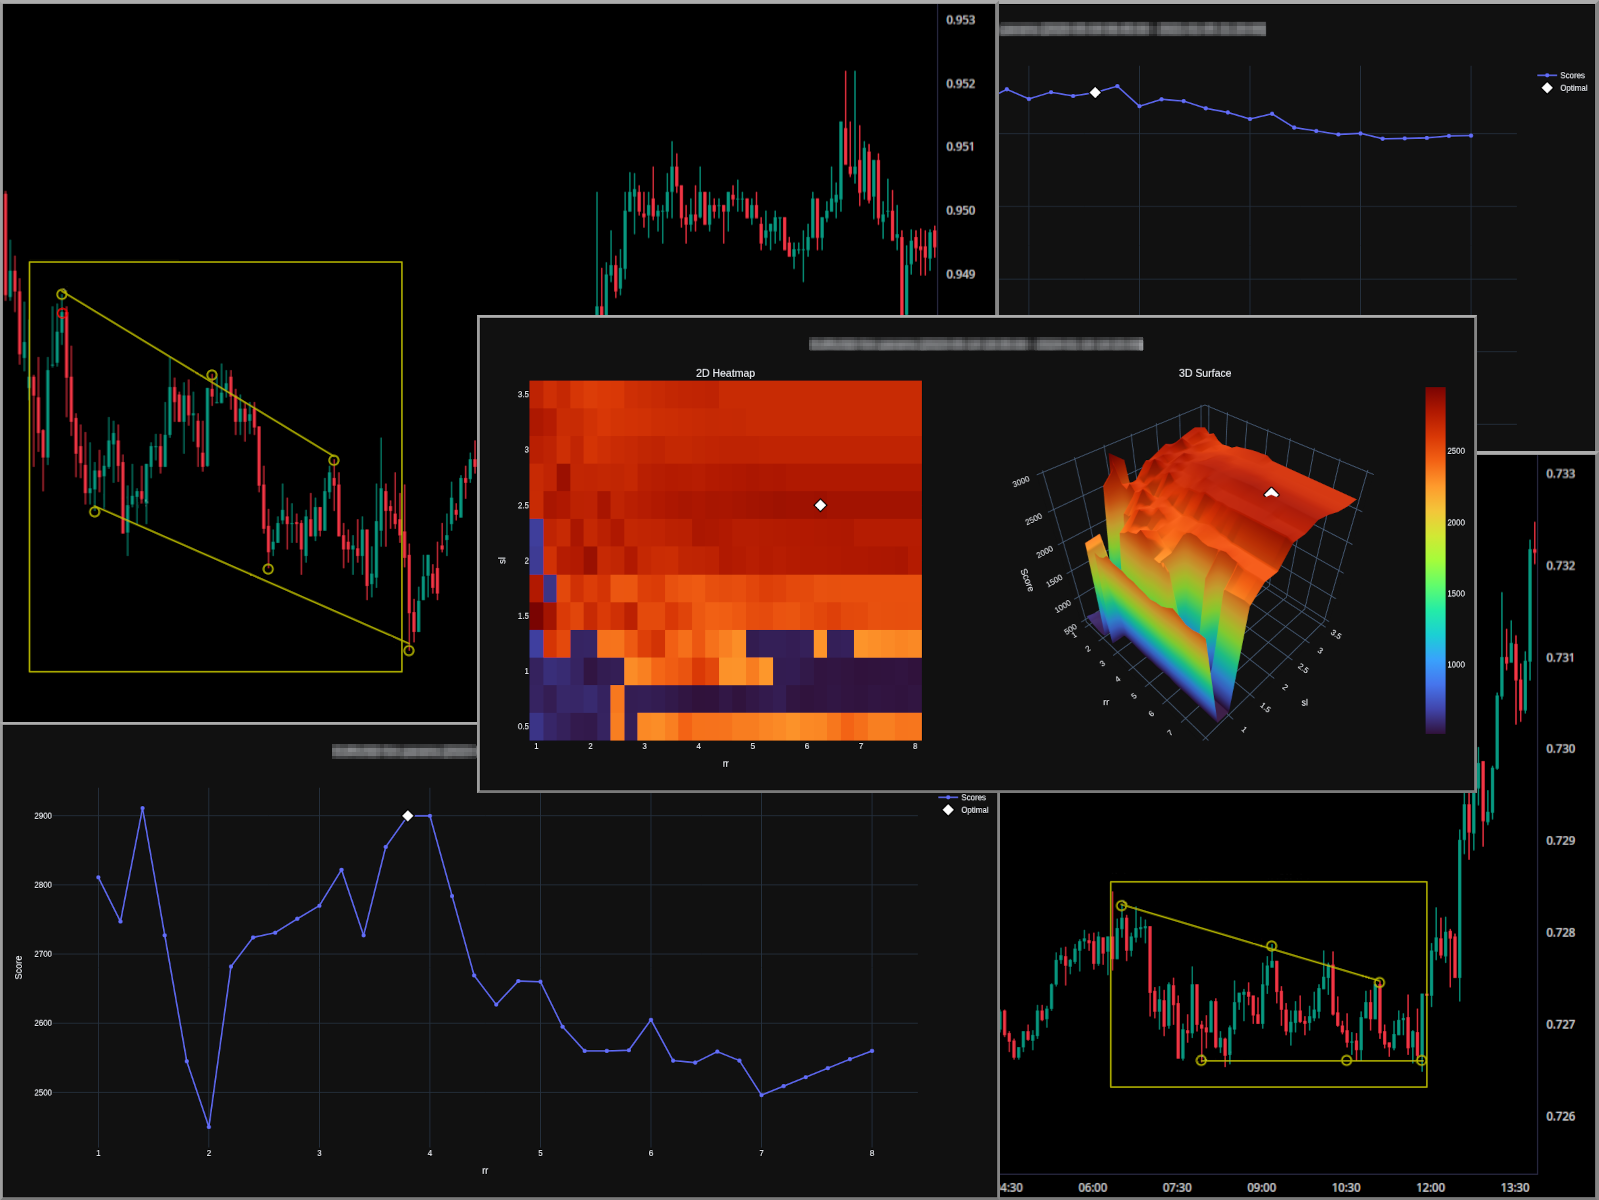
Once a strategy is defined, data becomes our validation engine. We test our models against massive historical datasets, running through optimizations like WFO to identify the most robust entry and exit parameters. This ensures our systems don't just look good on paper but are actually built to adapt lo live market data, constantly evolving and improving long after their initial creation.
What we get
The ultimate output of our engineering is clarity. Our process reveals the difference between a true market edge and a temporary market illusion.
Every entry and exit level is mapped directly to price action, giving us clarity on why a strategy behaves the way it does. We get the data that tells us what survives out of sample — and what needs to be discarded.
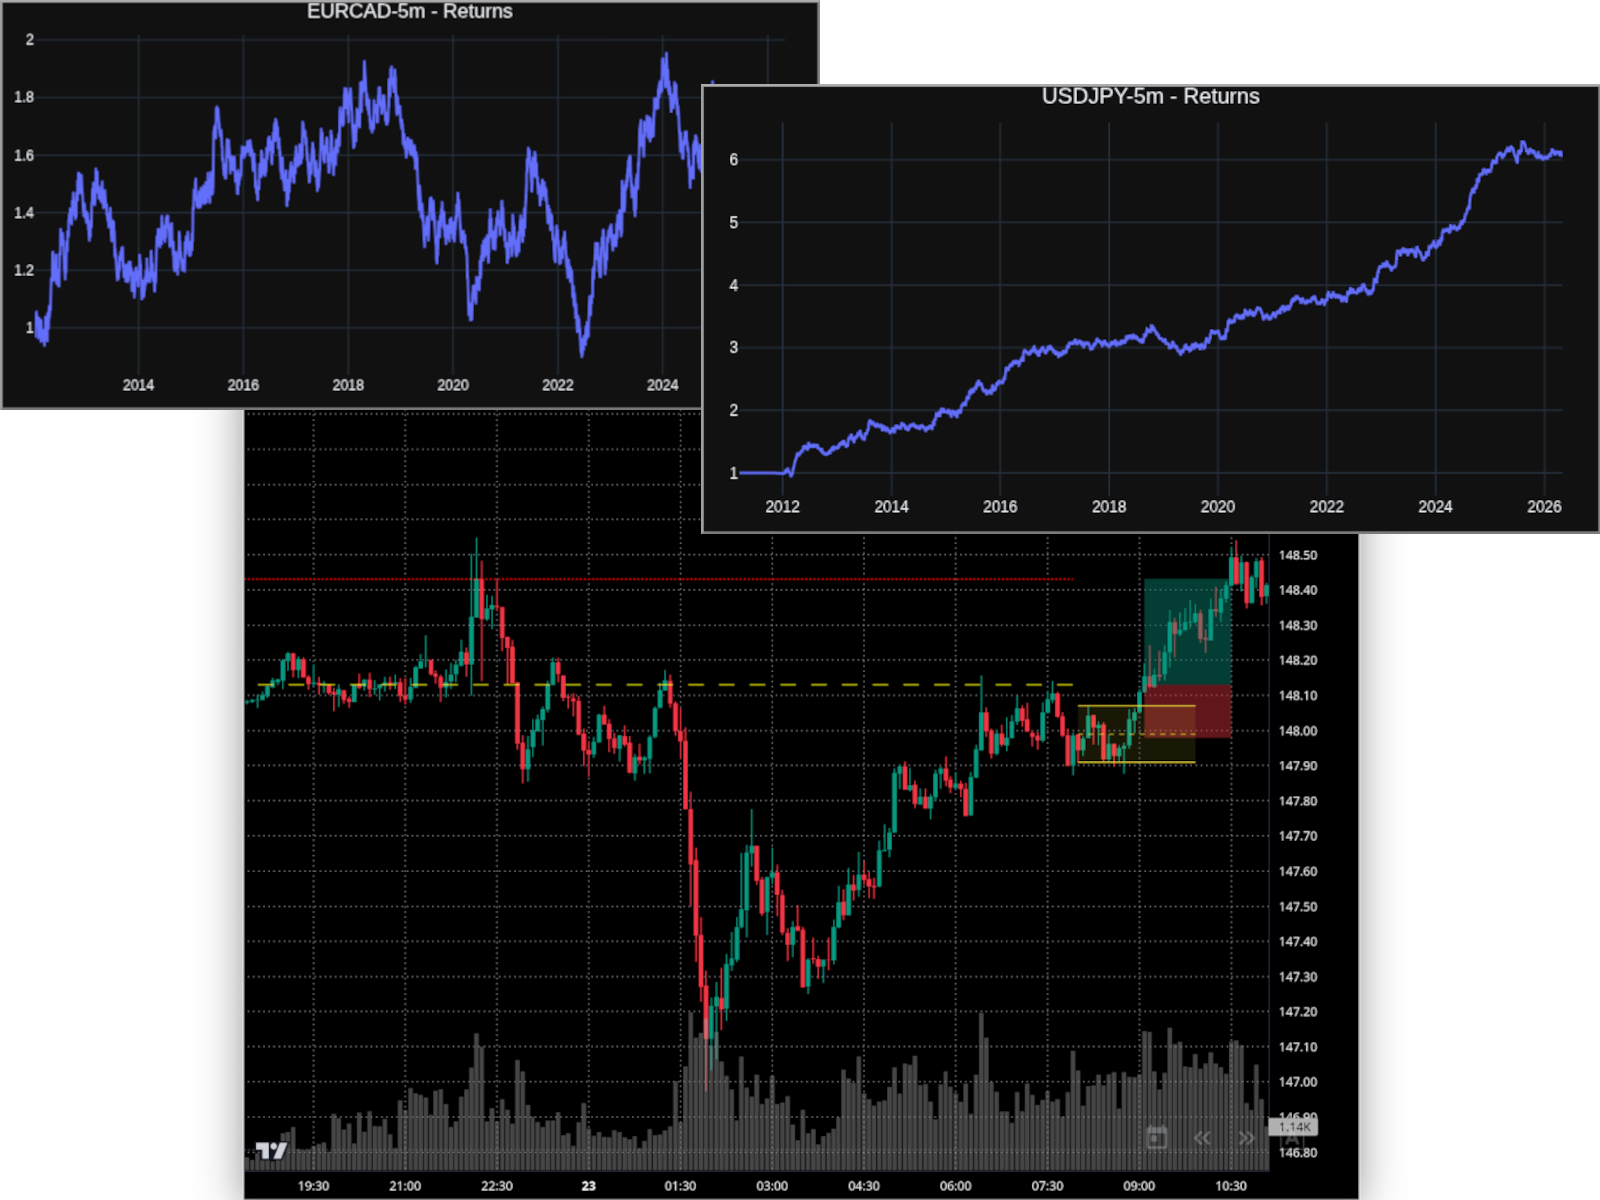
Our payloads use a flat YAML structure. It is immediately readable at a glance for manual review, yet fully parseable if you want to integrate it into your own simulation scripts.
Because data feeds vary slightly between Prop Firms, absolute prices can be misleading. To ensure clear interpretation, we include a price chart where reference levels are mapped visually against price action. The YAML payload is delivered directly within the image caption.
Account sizes and drawdown limits vary between evaluations, making position sizing a
common hurdle. To provide a clear baseline, all our broadcasted models are normalized
to a $100 baseline risk.
The size field reflects this standard,
allowing you to easily scale the data to match specific evaluation parameters.
MODEL_OUTPUT: v1.0
symbol: EURUSD
ticket: 3503930
action: OPEN
type: BUY_STOP
price: 1.1608
sl: 1.1599
tp: 1.16616
size: 1.11
expiration: 2026-06-17 11:15:00 -04003503947 (OCO 3503930).
BUY | SELL (Market orders) or
BUY_LIMIT | SELL_LIMIT |
BUY_STOP | SELL_STOP (Pending orders).
"Order filled",
a pending order was triggered into an active position (do not open a new one!).
MODEL_OUTPUT: v1.0
symbol: GBPUSD
ticket: 316498444
action: MODIFY
type: BUY
price: 1.3352
sl: 1.33534
tp: 1.33897
msg: Trailing Stop modifiedBUY or
SELL).
"SL modified", "TP modified", or
"Trailing Stop modified"
(manage manually if unsupported natively).
MODEL_OUTPUT: v1.0
symbol: GBPUSD
ticket: 25649842
action: CLOSED
type: SELL_STOP
msg: Order expiredMODEL_OUTPUT: v1.0
symbol: GBPUSD
ticket: 5164284
action: CLOSED
type: BUY
price: 1.33899
pnl: 300.39
msg: TP hitOrder expired.
SL hit and
TP hit.
pnl field
dictates the outcome (e.g., an "SL hit" may result in a positive PnL if a trailing
stop was used).
Data via API
Our data feeds are designed exclusively for simulated environments, such as Proprietary Trading Firms. We provide analytical data to help you understand market behavior and develop your skill set. This is strictly an educational tool; it is not financial advice and must not be used in live markets where execution conditions differ.
We publish a selection of our system outputs via Telegram. Translating raw algorithmic execution into a structured data feed requires robust engineering. There is no human behind a screen — just the output of our quantitative models, delivered as data is processed. And we do it the only way engineers know: using a structured API.
Infrastructure Access
We categorize our data feeds by asset class and operational frequency rather than commercial tiers. Connect to the option that fits your evaluation setup.
Cancel anytime. No long-term commitment.
Secure authentication via Telegram. Payment processing powered by Whop.